Table of Contents
Price Action Indicator
System Overview
Introduction
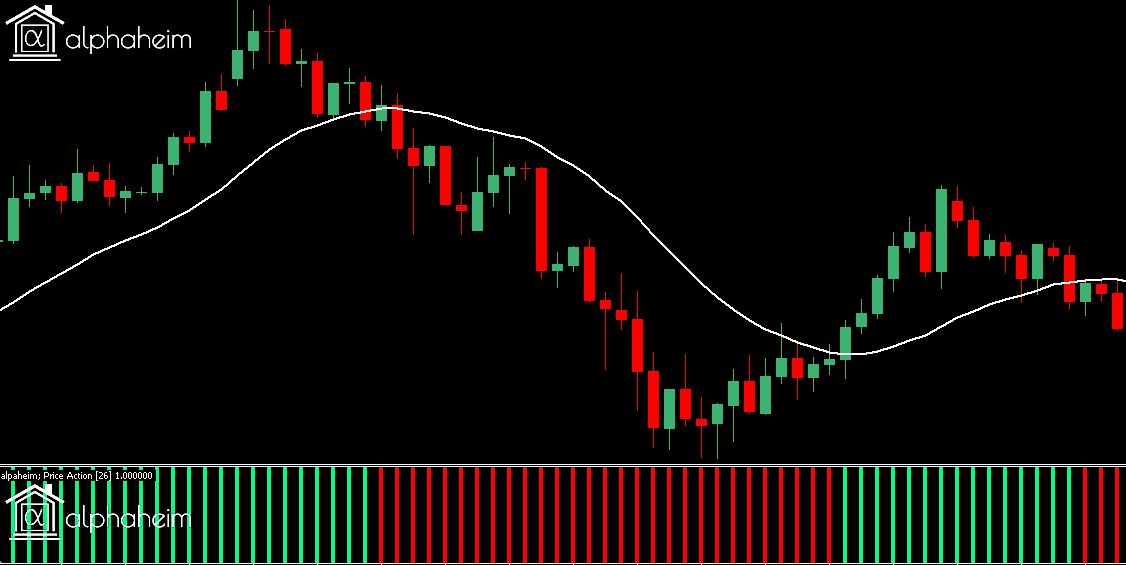
Our price action indicator presents a simple histogram showing the relative position of price against a user defined moving average.
When price is above the selected moving average, the histogram will display a bullish bias. Conversely, when price is below the moving average, a bearish bias will be displayed.
Inputs
Averaging Period
- The averaging period for the Moving Average.
Applied Method
- Type of Moving Average applied to the data feed.
Applied Price
- Type of data input for the Moving Average calculations.