Table of Contents
Trend Divergence
System Overview
Introduction
The oscillator is based upon a zero-lag cycle phase implementation on price movement. A superimposed cyclical trend analysis is performed to produce an exact synchronization with the trend cycle component in the data. The algorithm will assess the significance between slope and each data point of the trend cycle period and plot the divergence signals as arrows.
Divergence Variants
Our in-house developed divergence indicator will plot four different divergence variations.
Classical Bullish Divergence
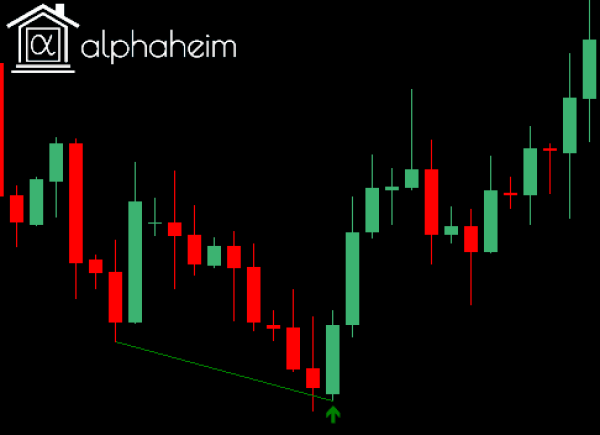
- Price is making lower lows (LL), but the trend data is making higher lows (HL)
- Following the signal, if the trend data fails to make a new low, it is likely that the price will rise, as price and momentum are normally expected to move in line with each other.
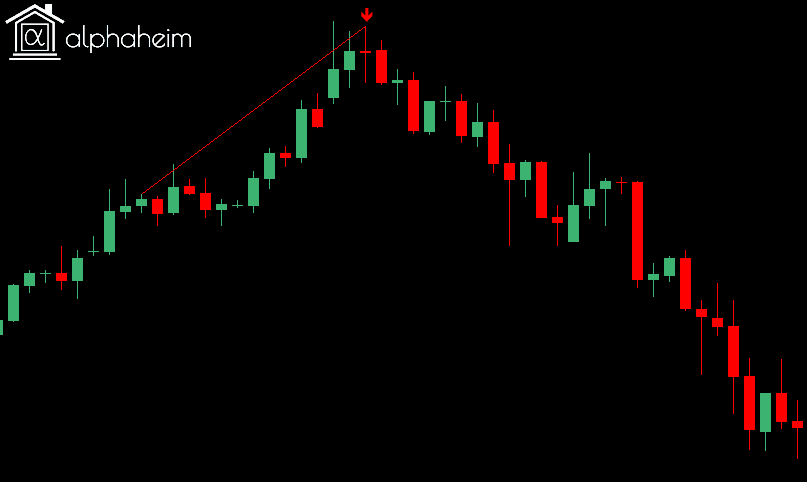
Classical Bearish Divergence
- Price is making higher highs (HH), but the trend data is making lower highs (LH)
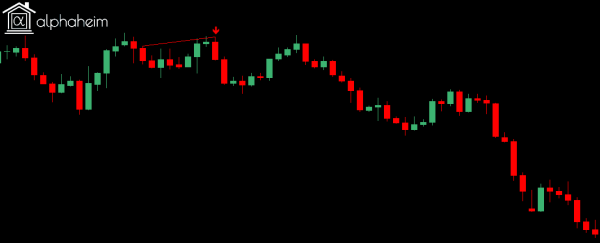
Hidden Bullish Divergence
- Price is making higher lows (HL), but the trend data is showing lower lows (LL)
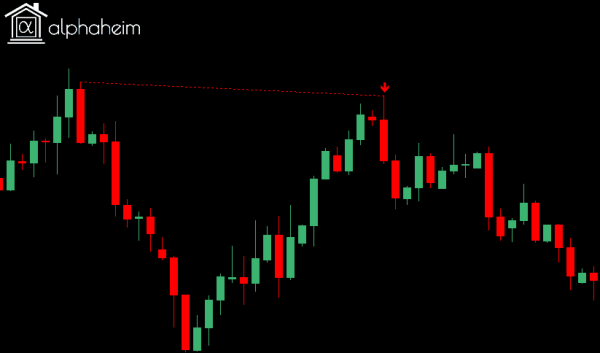
Hidden Bearish Divergence
- Price is making lower highs (LH), but the trend data is making higher highs (HH)
Indicator
Inputs
Trend Length:
- “Look-back” for the cycle phase.
- This is not the same as a typical averaging period. Small changes in the length can vary the output significantly.
Draw Price Action Trend Lines
- Option for drawing the divergence price action trend lines on the main chart.
- Lines are drawn as Objects on the chart
Alerts
- If enabled, upon a newly confirmed divergence signal, a notification alert will be presented to the terminal.
Enable Classical Divergences
- Option will permit the identification and drawing of Classical Divergences
- Classical divergence setups are drawn as solid lines
- Ideal for stop and reverse trading
Enable Hidden Divergences
- Option will permit the identification and drawing of Hidden Divergences
- Hidden divergence setups are drawn as dashed lines
- Ideal for trend continuation trading
Notes
Trading:
- Trading every signal provided by the indicator will likely result in a loss-making strategy. It is imperative to consider other market factors. For divergence trading, key support and resistance levels will help filter erroneous signals. For the divergences, additional filtering may be suitable based upon the number of candles spanned, the price action difference.
Hidden Buffers:
- We have programmed four hidden buffers to aid any automation from the indicator.
Divergence Type:
- Buffer Index = 3
- Output Values:
- 1 = Classical Bullish Divergence
- 2 = Hidden Bullish Divergence
- 3 = Classical Bearish Divergence
- 4 = Hidden Bearish Divergence
Price Action Difference:
- Buffer Index = 5
- On the signal candle, this buffer will hold the absolute difference between the two divergence price points.
- Low price differences are used for bullish divergences, and high prices for bearish divergences.
Divergence Span Length:
- Buffer Index = 6
- On the signal candle, this buffer will hold the number of candles for which the divergence pattern spans across.
Dashboard
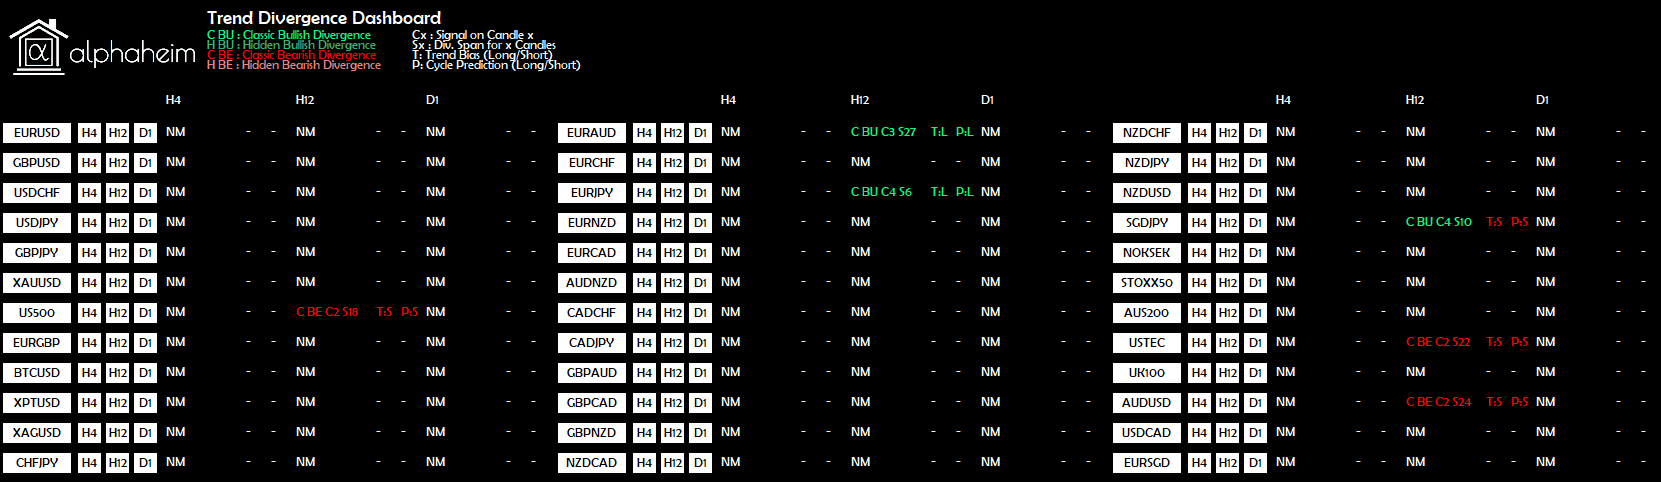
Overview
Divergence signals are produced at a lesser frequency than other indicators. For this reason, it is crucial to monitor a large number of symbols to find possible trading opportunities. We have designed a dashboard to scan as many symbols as the user desires, and provide further information about the signal, extending beyond the scope of the divergence signal.
Our dashboard will alert you of any new signals, but will also provide:
- Candle index for which the signal was produced
- 0 is always referenced as the current candle
- Number of candles for which the divergence spans across
- Lag reduced indication of Trend Direction
- Zero lag prediction attempt based upon Cyclical Price Action analysis
The dashboard is fully interactive, allowing for an easier trading experience. Each symbol has an associated button, for each selected time frame. Clicking the button instantly opens the chart, saving the hassle of scrolling through the Market Watch to find the symbol.
Dashboard Layout
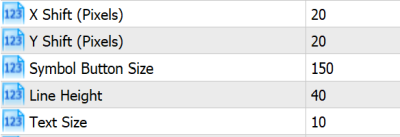
We have designed our dashboard to accommodate the average display, but due to MetaTrader’s display infrastructure, we are unable to automatically adapt to every single display, by default, whilst ensuring an efficient spacing matrix.
If your dashboard appears incorrectly, i.e. too congested/spaced, then please adjust the X Shift, Y Shift, Symbol Button Size, Line Height inputs. For example, using a 4k display, we have found the setup below to offer better results, but will likely need to be tampered with for individual displays.
Inputs
Symbols
- By default, this is set to empty. When empty, the dashboard will use all symbols, actively selected in the “Market Watch”.
- The symbols within the “Market Watch” can be viewed by navigating within MetaTrader from View→Market Watch, or by hitting CTRL+M.
- If manual symbol selection is to be used, a strict formatting scheme must be followed.
- The symbols must be comma separated, and have no white space and no quotation marks.
- For example, if the dashboard is only to scan GBPUSD, AUDUSD and XAUUSD, the input would be GBPUSD,AUDUSD,XAUUSD
- If your broker has modified symbols with any prefixes or suffixes, these must also be entered
Search Period
- Divergence patterns will never appear on the current candle, or the preceding candle.
- A pattern will only appear, at the very earliest, on the second candle.
- The search period specifies, from the second candle inclusive, looking back, how many candles should be scanned to check for a pattern.
Classic Divergence / Hidden Divergence
- The dashboard will be restricted to only display the specified variant of divergence.
Trend Length
- Main indicator value for signal production.
- “Look-back” for the cycle phase.
- This is not the same as a typical averaging period. Small changes in the length can vary the output significantly.
Fast Trend Length
- Length for additional trend direction filter.
- Functions similar to a typical averaging period.
Price Action Cycle Period
- The number of bars in cyclic price action filter.
Price Action Cycle Bandwidth
- The tolerance of the measurement of the price action cycle period.
Alerts On
- Enables push notifications to the terminal for divergence patterns.
- Required for Mobile/Email alerts.
Mobile Push Alerts
- Enables push notifications to your mobile device.
- For this feature to operate, you must have the MetaTrader mobile app installed on your device, and you must enter the device’s MetaQuotes ID into the main MetaTrader terminal, under Tools→Options→Notifications.
Email Alerts
- Enables email notifications.
- For this feature to operate, you must have the MetaTrader email settings correctly configured under Tools→Options→Email.
Symbols Per Column
- Each MetaTrader terminal is of a different size, depending on the user’s individual settings.
- To adjust the number of symbols, per column, within the dashboard, change this input.
X Shift / Y Shift / Symbol Button Size / Line Height / Text Size
- MetaTrader charts are generated from predefined pixel locations. Unfortunately, due to different monitors having different PPI (Pixels Per Inch) counts, it is impossible to generate a dashboard catering to every monitor, whilst also being efficient with spacing.
- By default, the dashboard layout matrix is designed for displays with an average PPI count, in an attempt to cover as many displays as possible.
- If for example, your display has a higher PPI count, then the size of the buttons will be smaller than necessary, and the information display will be inconvenient.
Use x timeframe
- Enables scanning of the specified time frame.
- If no timeframe is set to true, the dashboard will not load.
- Please do not select more than 3 timeframes.
Important Considerations
Data availability
The dashboard will function improperly if there is insufficient data for a specified symbol. To overcome this issue, ensure that every scanned symbol has enough bar data, for the specific timeframe being scanned. Once a chart has been loaded, ensure that the alphaheim; Trend Divergence indicator can be loaded, and correctly displays signals. Once this process has been complete, it the dashboard will never have further issues with regards to data.
Loading Times
Upon initial loading of the dashboard, the layout matrix, including the buttons, should appear very quickly. Please keep a track of the “Journal” and “Experts” tab under the Terminal Toolbox. If the layout does not appear within 10 seconds, and nothing is being updated in the tabs, then we recommend closing the chart, and attempt reloading.
After the layout has loaded, the loading time of the signals will vary, according to which MetaTrader version is being used, and how many scans are being performed. For MetaTrader 4 uses, please be patient, and avoid interrupting the terminal. MT4 only operates on a single core, and will take approximately 25 seconds to load 45 symbols across 3 different timeframes. Whilst the scans are being performed, you will be unable to use the terminal. If scanning timeframes under M5, please do not enforce a large number of symbols.
The dashboard will only update upon the initial load, and then for the opening of every new candle for the shortest timeframe being applied.
Our layout matrix has been designed to only handle a maximum of 3 timeframes for any given dashboard. We have designed this restriction to keep computation times low. If you would like to load more than 3 timeframes, please open another instance of the dashboard, on another chart.