Table of Contents
Volume Insight & Divergence
System Overview
Introduction
Volume analysis plays an imperative role in the determination of a market’s bias. By inspecting the flow of money in a particular direction, it is possible to project upcoming trends and filter erroneous trades against an asset’s overall sentiment.
Typical volume indicators such as the On-Balance-Volume (OBV) provide a useful insight, but lack a significant bias indication and are extremely choppy. Our Volume Insight indicator solves this issue by providing a bias for the flow of money within the asset over a defined period, and also smooths out the cumulative differences to filter out the noise. Application of our smoothing algorithm warrants our Volume Divergence indicator to produce high quality trading signals, with a significant edge over OBV divergences, a highly profitable system in itself.
Volume Divergence Variants
Our in-house developed divergence indicator will plot four different divergence variations.
Classical Bullish Divergence
- Price is making lower lows (LL), but the oscillator is making higher lows (HL).
Classical Bearish Divergence
- Price is making higher highs (HH), but the oscillator is making lower highs (LH).
Hidden Bullish Divergence
- Price is making higher lows (HL), but the oscillator is showing lower lows (LL).
Hidden Bearish Divergence
- Price is making lower highs (LH), but the oscillator is making higher highs (HH).
Indicator
Volume Insight/Divergence Indicator
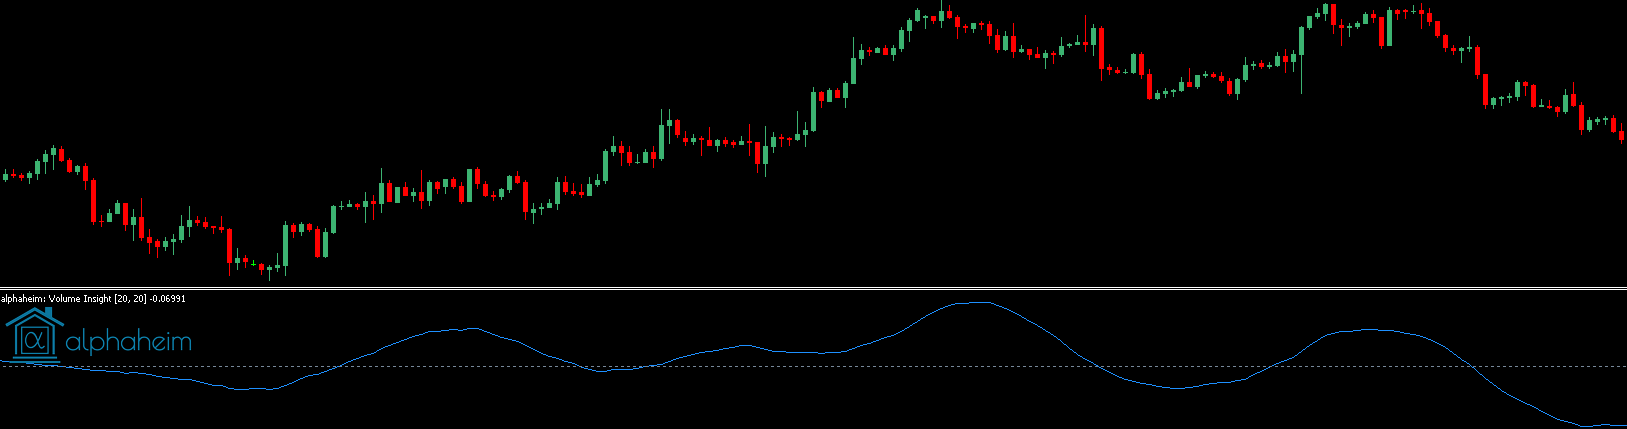
Volume Period
- “Look-back” period for the volume calculations.
- Our indicator will inspect the cumulative volume accumulation, dependent on the direction of movement.
Averaging Period
- Averages the volumes over a defined period, alleviating choppiness.
Averaging Method:
- Averaging method.
Applied Volume (MT5 Only):
- Type of volume to be used for underlying calculations.
- Forex assets typically utilise Tick Volumes, whereas equities typically utilise Real Volumes.
Volume Divergence Indicator
Enable Classical Divergences
- Option will permit the identification and drawing of Classical Divergences.
- Classical divergence setups are drawn as solid lines.
- Ideal for stop and reverse trading.
Enable Hidden Divergences
- Option will permit the identification and drawing of Hidden Divergences.
- Hidden divergence setups are drawn as dashed lines.
- Ideal for trend continuation trading.
Notes
Volume Insight Crossover
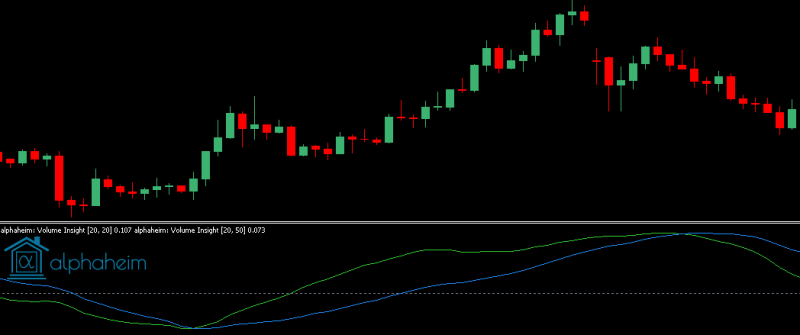
One possible trading strategy may utilise the faster movement in volume against a slower moving average of volumes. In the image above, a faster moving volume average is visualised with a green line, and the slower with a blue line.
Volume Divergences
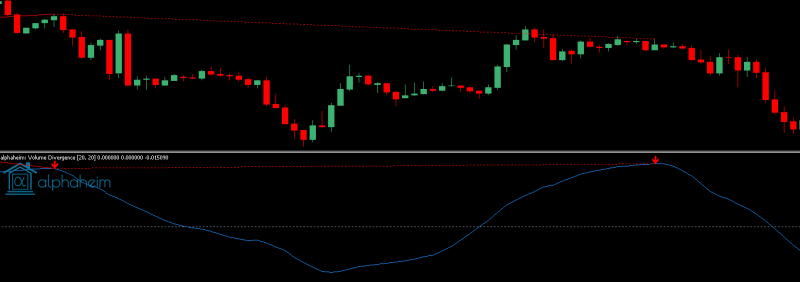
Our volume divergence signals have a high predictive accuracy when utilised with the correct settings for a given asset and time frame. From above, two trading signals were provided on EURUSD H1, a classical bearish divergence and a hidden bearish divergence, both yielding highly profitable trades.
Volume divergences can be traded with higher accuracy by considerations of key support and resistance levels in conjunction with Fibonacci levels.
Volume Insight Combined with alphaheim;Timing Indicator
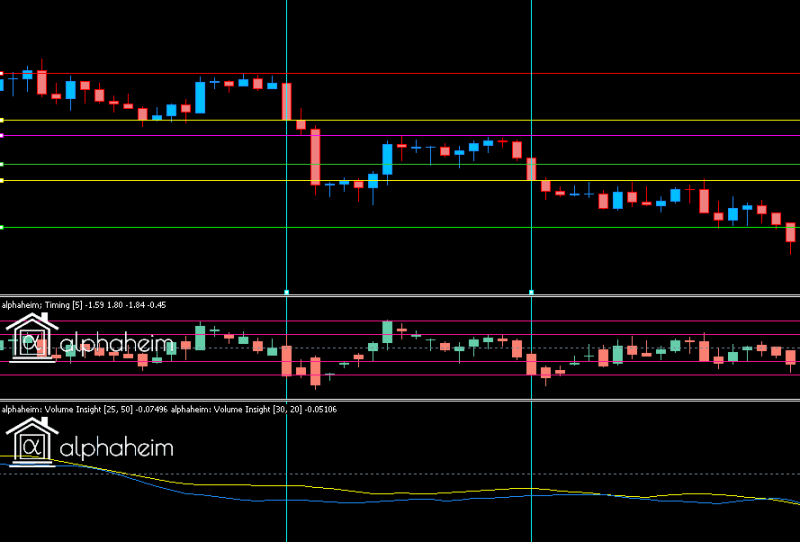
Another high probability trading method can be achieved utilising our Volume Insight indicator, applied twice, combined with our timing indicator. In the image above are two short trades signalled by our trading system.
Our first check is to ensure a bullish timing candle has crossed below a certain threshold. In this case, the set threshold is -8.
Our secondary confirmation is to ensure the faster moving volume insight line is less than zero, and also below the slower moving volume insight.
In the image above, the yellow and orange lines represent the trade entry for each respective trade. In the hourly chart above, we have used a 10-bar high for the SL, with a Risk:Reward ratio of 1. However, we also highly recommend experimenting with ATR based SL from alternating timeframes. For example, on a H1 chart, we have found great success using a SL based on the M30 ATR applied with a set multiplier, and a R: R of 1.5.
Ideal Trading Setup
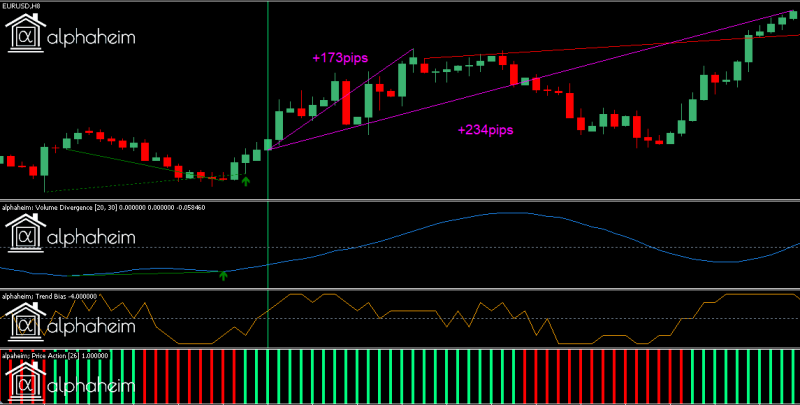
Our recommended trading strategy has been derived from extensive stress tests and strategy curation. This strategy combines our unique indicators, and provides a refreshing approach to trading.
In the example above, a long position was placed on the open of the vertical green line.
Long Trade logic:
- Bullish divergences on both Volume and Trend indicators, within x candles. In the case above, x was defined as 5.
- The Trend Bias indicator is greater than, or equal to 0. For stronger confirmations it would have been possible to wait until the bias was strictly greater than 0.
- Depending on the market conditions, a consideration may be provided to Fibonacci levels.
- Stop-Loss placement can vary according to a trader’s preference. In the case above, the SL was placed at a recent swing low.
As evident from the magenta line, the maximum profit potential for this specific trade was 230 pips. On average, when utilising this strategy on higher timeframes, we have found setups to have an accuracy rating of 83%, whereby an accurate setup is defined as yielding a profitable trade with a Risk: Reward greater than 1. The maximum pip potential does have a relatively large variation, ranging up to 1500pips.
Volume Divergence Indicator Hidden Buffers
We have programmed four hidden buffers to aid any automation from the indicator.
Divergence Type
- Buffer Index = 3
- Output Values:
- 1 = Classical Bullish Divergence
- 2 = Hidden Bullish Divergence
- 3 = Classical Bearish Divergence
- 4 = Hidden Bearish Divergence
Oscillator Difference
- Buffer Index = 4
- On the signal candle, this buffer will hold the absolute difference between the two divergence extrema.
Price Action Difference
- Buffer Index = 5
- On the signal candle, this buffer will hold the absolute difference between the two divergence price points.
- Low price differences are used for bullish divergences, and high prices for bearish divergences.
Divergence Span Length
- Buffer Index = 6
- On the signal candle, this buffer will hold the number of candles for which the divergence pattern spans across.
Dashboard
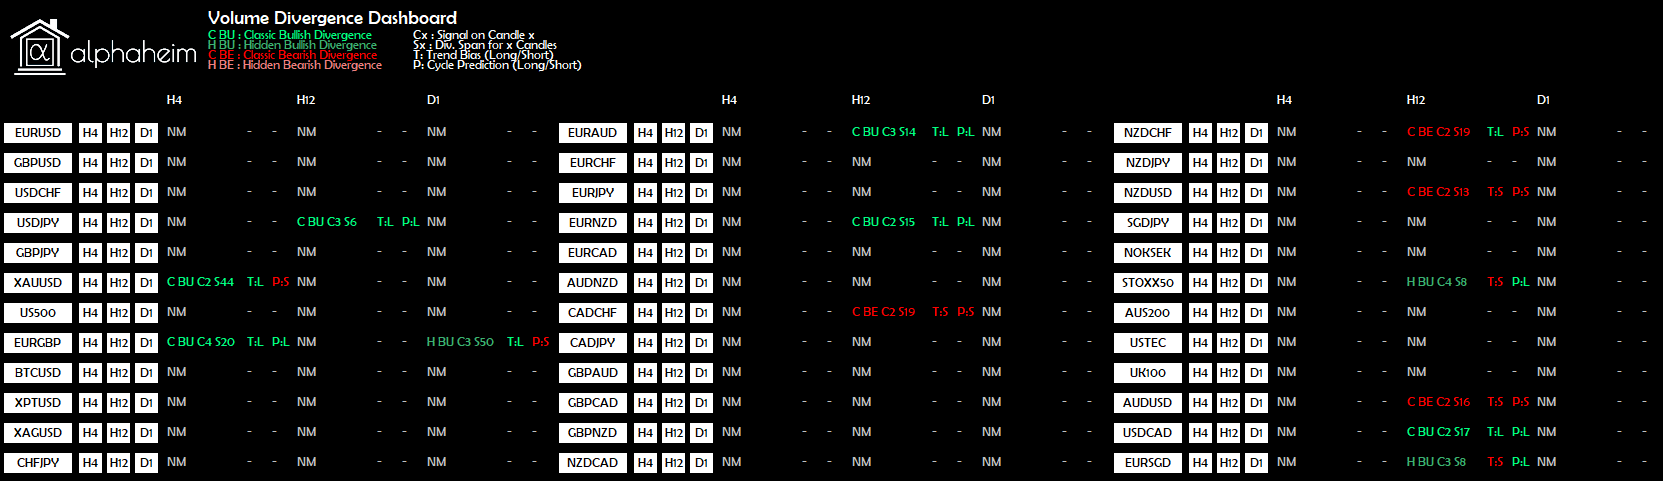
Overview
Divergence signals are produced at a lesser frequency than other indicators. For this reason, it is crucial to monitor a large number of symbols to find possible trading opportunities. We have designed a dashboard to scan as many symbols as the user desires, and provide further information about the signal, extending beyond the scope of the divergence signal.
Our dashboard will alert you of any new signals, but will also provide:
- Candle index for which the signal was produced.
- 0 is always referenced as the current candle.
- Number of candles for which the divergence spans across.
- Lag reduced indication of Trend Direction.
- Zero lag prediction attempt based upon Cyclical Price Action analysis.
The dashboard is fully interactive, allowing for an easier trading experience. Each symbol has an associated button, for each selected time frame. Clicking the button instantly opens the chart, saving the hassle of scrolling through the Market Watch to find the symbol.
Dashboard Layout
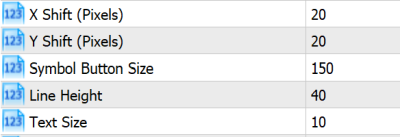
We have designed our dashboard to accommodate the average display, but due to MetaTrader’s display infrastructure, we are unable to automatically adapt to every single display, by default, whilst ensuring an efficient spacing matrix.
If your dashboard appears incorrectly, i.e. too congested/spaced, then please adjust the X Shift, Y Shift, Symbol Button Size, Line Height inputs. For example, using a 4k display, we have found the setup below to offer better results, but will likely need to be tampered with for individual displays.
Inputs
Symbols
- By default, this is set to empty. When empty, the dashboard will use all symbols, actively selected in the “Market Watch”.
- The symbols within the “Market Watch” can be viewed by navigating within MetaTrader from View→Market Watch, or by hitting CTRL+M.
- If manual symbol selection is to be used, a strict formatting scheme must be followed.
- The symbols must be comma separated, and have no white space and no quotation marks
- For example, if the dashboard is only to scan GBPUSD, AUDUSD and XAUUSD, the input would be GBPUSD,AUDUSD,XAUUSD
- If your broker has modified symbols with any prefixes or suffixes, these must also be entered.
Search Period
- Divergence patterns will never appear on the current candle, or the preceding candle.
- A pattern will only appear, at the very earliest, on the second candle.
- The search period specifies, from the second candle inclusive, looking back, how many candles should be scanned to check for a pattern.
Classic Divergence / Hidden Divergence
- The dashboard will be restricted to only display the specified variant of divergence.
Volume Period
- “Look-back” period for the volume calculations.
- Our indicator will inspect the cumulative volume accumulation, dependent on the direction of movement.
Averaging Period
- Averages the volumes over a defined period, alleviating choppiness.
Averaging Method
- Averaging method.
Applied Volume (MT5 Only)
- Type of volume to be used for underlying calculations.
- Forex assets typically utilise Tick Volumes, whereas equities typically utilise Real Volumes.
Fast Trend Length
- Length for additional trend direction filter.
- Functions similar to a typical averaging period.
Price Action Cycle Period
- The number of bars in cyclic price action filter.
Price Action Cycle Bandwidth
- The tolerance of the measurement of the price action cycle period.
Alerts On
- Enables push notifications to the terminal for divergence patterns
- Required for Mobile/Email alerts.
Mobile Push Alerts
- Enables push notifications to your mobile device.
- For this feature to operate, you must have the MetaTrader mobile app installed on your device, and you must enter the device’s MetaQuotes ID into the main MetaTrader terminal, under Tools→Options→Notifications.
Email Alerts
- Enables email notifications.
- For this feature to operate, you must have the MetaTrader email settings correctly configured under Tools→Options→Email.
Symbols Per Column
- Each MetaTrader terminal is of a different size, depending on the user’s individual settings.
- To adjust the number of symbols, per column, within the dashboard, change this input.
X Shift / Y Shift / Symbol Button Size / Line Height / Text Size
- MetaTrader charts are generated from predefined pixel locations. Unfortunately, due to different monitors having different PPI (Pixels Per Inch) counts, it is impossible to generate a dashboard catering to every monitor, whilst also being efficient with spacing.
- By default, the dashboard layout matrix is designed for displays with an average PPI count, in an attempt to cover as many displays as possible.
- If for example, your display has a higher PPI count, then the size of the buttons will be smaller than necessary, and the information display will be inconvenient.
Use x timeframe
- Enables scanning of the specified time frame.
- If no timeframe is set to true, the dashboard will not load.
Important Considerations
Data availability
The dashboard will function improperly if there is insufficient data for a specified symbol. To overcome this issue, ensure that every scanned symbol has enough bar data, for the specific timeframe being scanned. Once a chart has been loaded, ensure that the alphaheim; Trend Divergence indicator can be loaded, and correctly displays signals. Once this process has been complete, it the dashboard will never have further issues with regards to data.
Loading Times
Upon initial loading of the dashboard, the layout matrix, there may be a noticeable delay. Please keep a track of the “Journal” and “Experts” tab under the Terminal Toolbox. If the layout does not appear within a few minutes, and nothing is being updated in the tabs, then we recommend closing the chart, and attempt reloading. When utilising a large number of symbols and a notable number of timeframes, please be patient as there is a vast amount of data to be processed.
After the layout has loaded, the loading time of the signals will vary, according to which MetaTrader version is being used, and how many scans are being performed. For MetaTrader 4 uses, please be patient, and avoid interrupting the terminal. MT4 only operates on a single core, and will take approximately 25 seconds to load 45 symbols across 3 different timeframes. Whilst the scans are being performed, you will be unable to use the terminal. If scanning timeframes under M15, please do not enforce a large number of symbols.
The dashboard will only update upon the initial load, and then for the opening of every new candle for the shortest timeframe being applied.