Trend Bias
System Overview
Introduction
What is the Trend Bias Indicator?
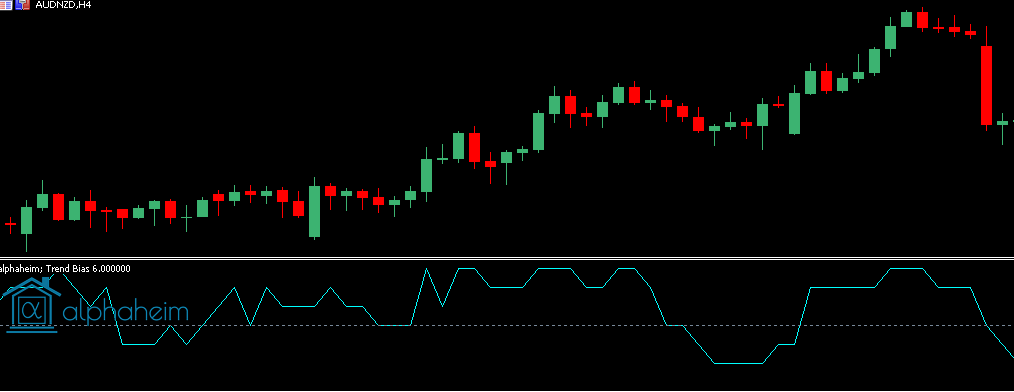
We have developed a proprietary points-based scoring mechanism to help identify the current market trend, and possible trend continuation. Our algorithm encompasses several different factors key for prediction, whilst also ensuring that the indicator does not lag.
The indicator will oscillate between +6 and -6, to visualise the direction bias at any given moment. By utilising a non-lagging approach, the key components of the algorithm adjust to big swings within the market.
Algorithm Components
Our trend bias indicator has been constructed using three core components.
- Superimposed Cyclical Trend Analysis
- Zero lag
- Exact synchronization with the Trend cycle component in the data
- Significance between slope and each data point of the trend cycle period.
- Normally distributed Trend Direction (and extrema)
- Heavily reduced lag.
- Conversion of non-normally distributed market price.
- Cyclical Price Action Analysis
- Negative lag.
- Cyclical turning points in price action.
- Negative group delay on first harmonic output of price data.
Indicator
Inputs
Trend Cycle Length
- The number of bars in the cyclic trend component.
Trend Direction Length
- The number of bars in the normalised trend direction component.
Price Action Cycle Period
- The number of bars in cyclic price action component.
Price Action Cycle Bandwidth
- The tolerance of the measurement of the price action cycle period.
Trading Techniques
Zero/Threshold Cross
A possible trading strategy may be to enter in the direction of the crossover with respect to the threshold value. As this is a lag reduced indicator, crosses will be frequent on lower time frames.
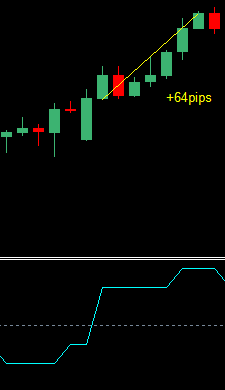
Gradient Shift at Extremum's
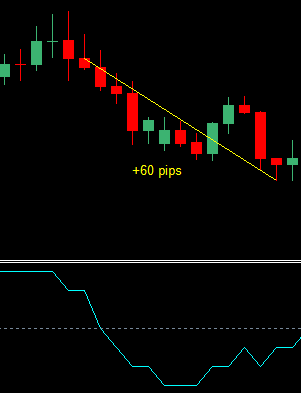
Another possible implementation is to trade a shift in gradient, provided the signal has been at an extremum for a specified period. In the example above, the signal had been fixed at +6 for 5 periods, then shifted downward.
Additional Filters
The cumulative output of this indicator reveals crucial information about the possible future outcome of a given symbol. Whilst it is impossible to predict where the market will go, our Trend Bias indicator provides a useful insight into the strength of the possible outcome, helping filter false signals from other trading systems, whilst also reinforcing accurate signals.
Dashboard
Overview
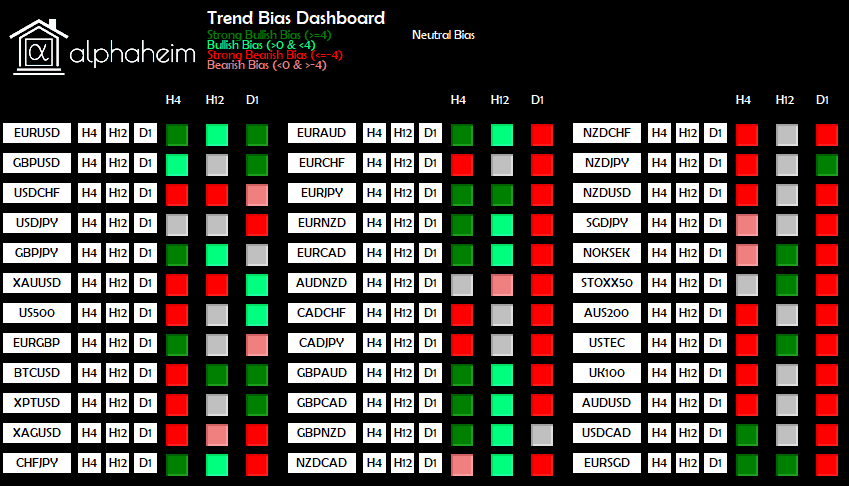
The trend bias indicator gives a useful insight into the symbol’s general bias on a specific timeframe, but it also imperative to get a larger overall view of the symbol’s market bias. Our Trend Bias dashboard provides a larger overview of the entire market through 4 colour codes, dependent on a user defined strength threshold.
The dashboard is fully interactive, allowing for an easier trading experience. Each symbol has an associated button, for each selected time frame. Clicking the button instantly opens the chart, saving the hassle of scrolling through the Market Watch to find the symbol.
Dashboard Layout
We have designed our dashboard to accommodate the average display, but due to MetaTrader’s display infrastructure, we are unable to automatically adapt to every single display, by default, whilst ensuring an efficient spacing matrix.
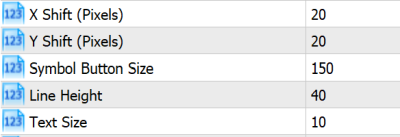
If your dashboard appears incorrectly, i.e. too congested/spaced, then please adjust the X Shift, Y Shift, Symbol Button Size, Line Height inputs. For example, using a 4k display, we have found the setup below to offer better results, but will likely need to be tampered with for individual displays.
Inputs
Symbols
- By default, this is set to empty. When empty, the dashboard will use all symbols, actively selected in the “Market Watch”.
- The symbols within the “Market Watch” can be viewed by navigating within MetaTrader from View→Market Watch, or by hitting CTRL+M.
- If manual symbol selection is to be used, a strict formatting scheme must be followed.
- The symbols must be comma separated, and have no white space and no quotation marks.
- For example, if the dashboard is only to scan GBPUSD, AUDUSD and XAUUSD, the input would be GBPUSD,AUDUSD,XAUUSD.
- If your broker has modified symbols with any prefixes or suffixes, these must also be entered.
Trend Length
- Main indicator value for signal production.
- “Look-back” for the cycle phase.
- This is not the same as a typical averaging period. Small changes in the length can vary the output significantly.
Fast Trend Length
- Length for additional trend direction filter.
- Functions similar to a typical averaging period.
Price Action Cycle Period
- The number of bars in cyclic price action filter.
Price Action Cycle Bandwidth
- The tolerance of the measurement of the price action cycle period.
Strong Bias Threshold
- Absolute threshold for strong bias signals.
- For example, if set to 4, any values greater than, or equal to 4, will present a Strong Bullish signal. Similarly, any signals below, or equal to -4, will present a Strong Bearish signal.
Alerts On
- Enables push notifications to the terminal for divergence patterns.
- Required for Mobile/Email alerts.
Mobile Push Alerts
- Enables push notifications to your mobile device.
- For this feature to operate, you must have the MetaTrader mobile app installed on your device, and you must enter the device’s MetaQuotes ID into the main MetaTrader terminal, under Tools→Options→Notifications.
Email Alerts
- Enables email notifications.
- For this feature to operate, you must have the MetaTrader email settings correctly configured under Tools→Options→Email.
Symbols Per Column
- Each MetaTrader terminal is of a different size, depending on the user’s individual settings.
- To adjust the number of symbols, per column, within the dashboard, change this input.
X Shift / Y Shift / Symbol Button Size / Line Height / Text Size
- MetaTrader charts are generated from predefined pixel locations. Unfortunately, due to different monitors having different PPI (Pixels Per Inch) counts, it is impossible to generate a dashboard catering to every monitor, whilst also being efficient with spacing.
- By default, the dashboard layout matrix is designed for displays with an average PPI count, in an attempt to cover as many displays as possible.
- If for example, your display has a higher PPI count, then the size of the buttons will be smaller than necessary, and the information display will be inconvenient.
Use x timeframe
- Enables scanning of the specified time frame.
- If no timeframe is set to true, the dashboard will not load.
- Please do not select more than 3 timeframes.
Important Considerations
Data Availability
The dashboard will function improperly if there is insufficient data for a specified symbol. To overcome this issue, ensure that every scanned symbol has enough bar data, for the specific timeframe being scanned. Once a chart has been loaded, ensure that the alphaheim; Trend Divergence indicator can be loaded, and correctly displays signals. Once this process has been complete, it the dashboard will never have further issues with regards to data.
Loading Times
Upon initial loading of the dashboard, the layout matrix, including the buttons, should appear very quickly. Please keep a track of the “Journal” and “Experts” tab under the Terminal Toolbox. If the layout does not appear within 10 seconds, and nothing is being updated in the tabs, then we recommend closing the chart, and attempt reloading.
After the layout has loaded, the loading time of the signals will vary, according to which MetaTrader version is being used, and how many scans are being performed. For MetaTrader 4 uses, please be patient, and avoid interrupting the terminal. MT4 only operates on a single core, and will take approximately 25 seconds to load 45 symbols across 3 different timeframes. Whilst the scans are being performed, you will be unable to use the terminal. If scanning timeframes under M5, please do not enforce a large number of symbols.
The dashboard will only update upon the initial load, and then for the opening of every new candle for the shortest timeframe being applied.
Our layout matrix has been designed to only handle a maximum of 3 timeframes for any given dashboard. We have designed this restriction to keep computation times low. If you would like to load more than 3 timeframes, please open another instance of the dashboard, on another chart.